Premium Dashboard
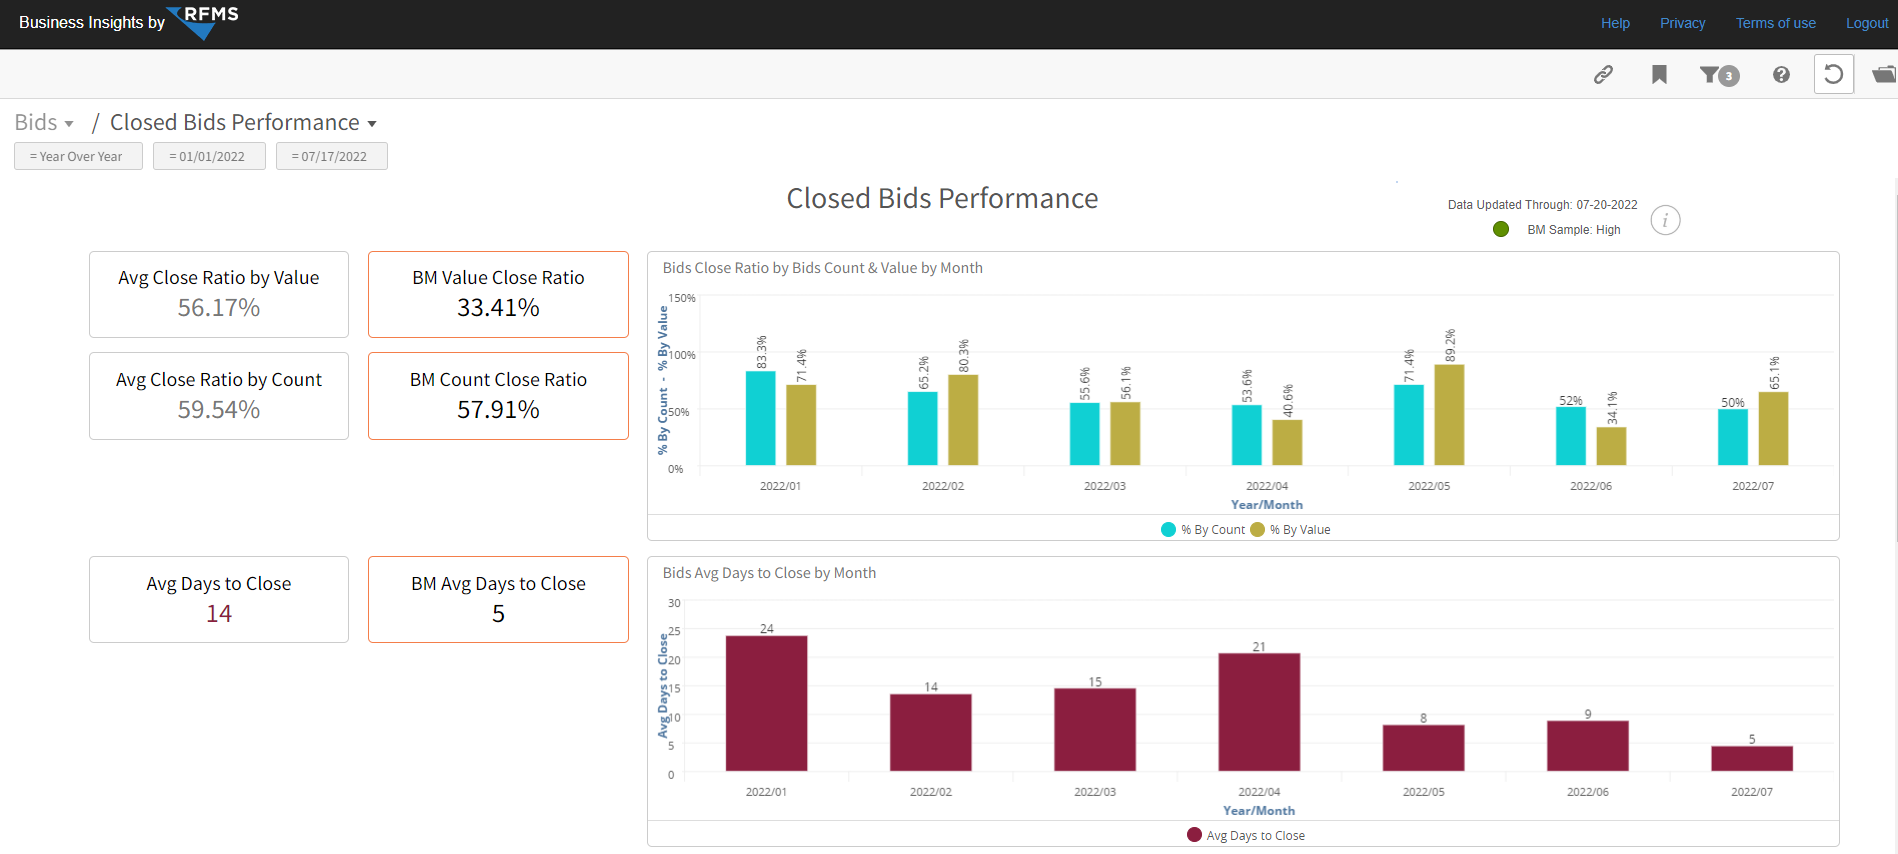
This dashboard provides closed bids value and count overall and by month. It also provides the benchmark values for value, count and days to close. Use the "My Store", “My Salesperson”, “My Job Types” and multiple benchmark filters to further refine the data for specific values.
Charts and Key Performance Indicators (KPI's)
Chart & KPI's
Avg Close Ratio by Value: The percentage of existing bids that are closed for the selected filters. This is calculated by dividing closed bid value by total bid value.
BM Value Close Ratio: The benchmark percentage of existing bids that are closed for the selected filters. This is calculated by dividing closed bid value by total bid value for all companies contributing to the benchmark.
Avg Close Ratio by Count: The percentage of closed bids. This is calculated by dividing the number of closed bids by the total number of bids.
BM Count Close Ratio: The benchmark percentage of closed bids benchmark. This is calculated by dividing the number of closed bids by the total number of bids for all companies contributing to the benchmark.
Chart
Bids Avg Days to Close by Month-The average number of days to close or convert bids into orders by month.
Chart & KPI's
Avg Days to Close: The average number of days to close bids convert bids into orders by month.
BM Avg Days to Close: The benchmark average of number (days) to close or convert bids into orders by month.
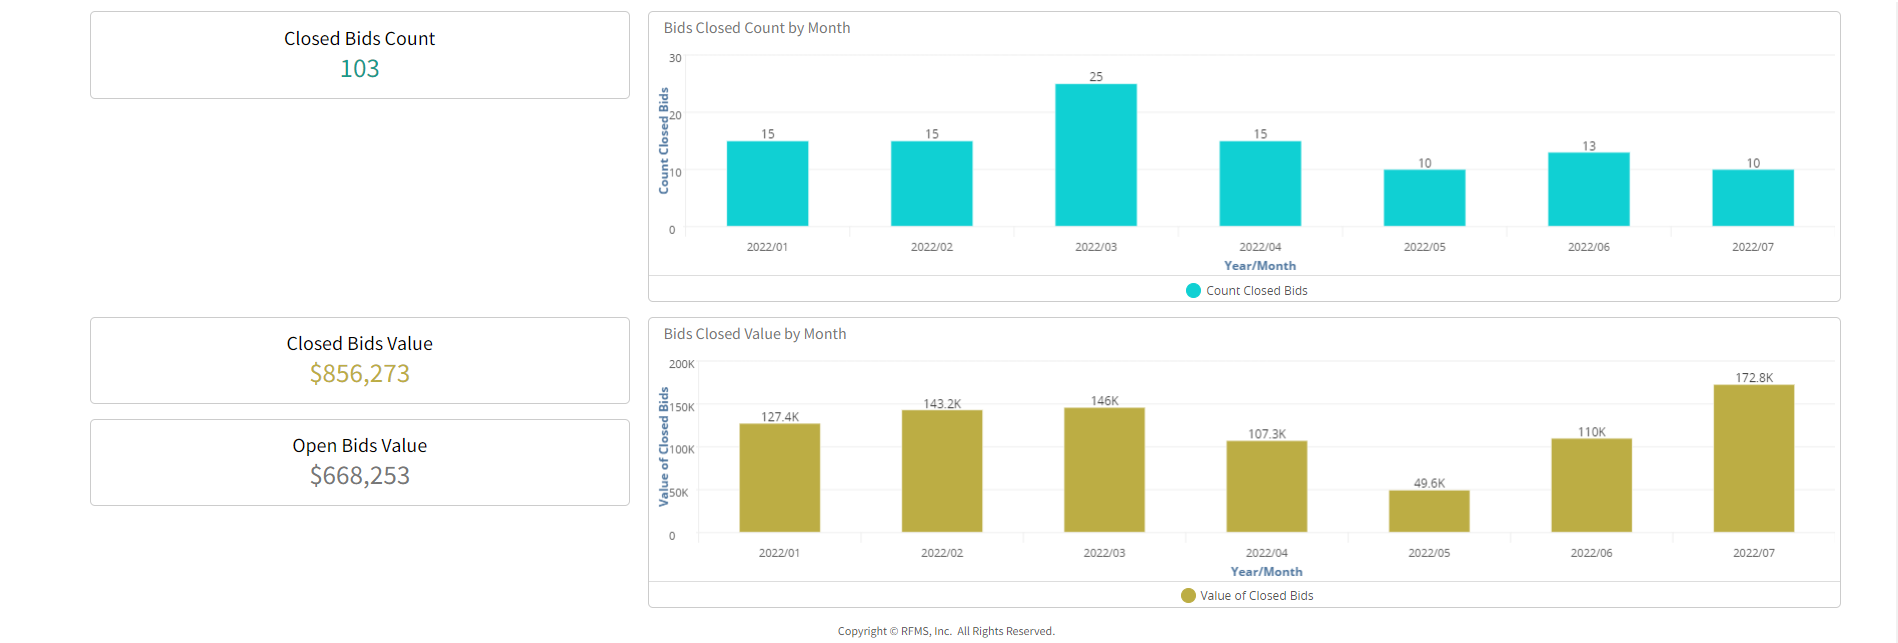
Bids Closed Count by Month
Chart & KPI
Closed Bid Count: The number of all closed bids for the active filters displayed by month.
Bids Closed Value by Month
Chart & KPI's
Closed Bid Value: The dollar value of all closed(exported) bids for the active filters displayed by month.
Open Bid Value: The dollar value of all open bids for the active filters displayed by month.
Comments
Article is closed for comments.