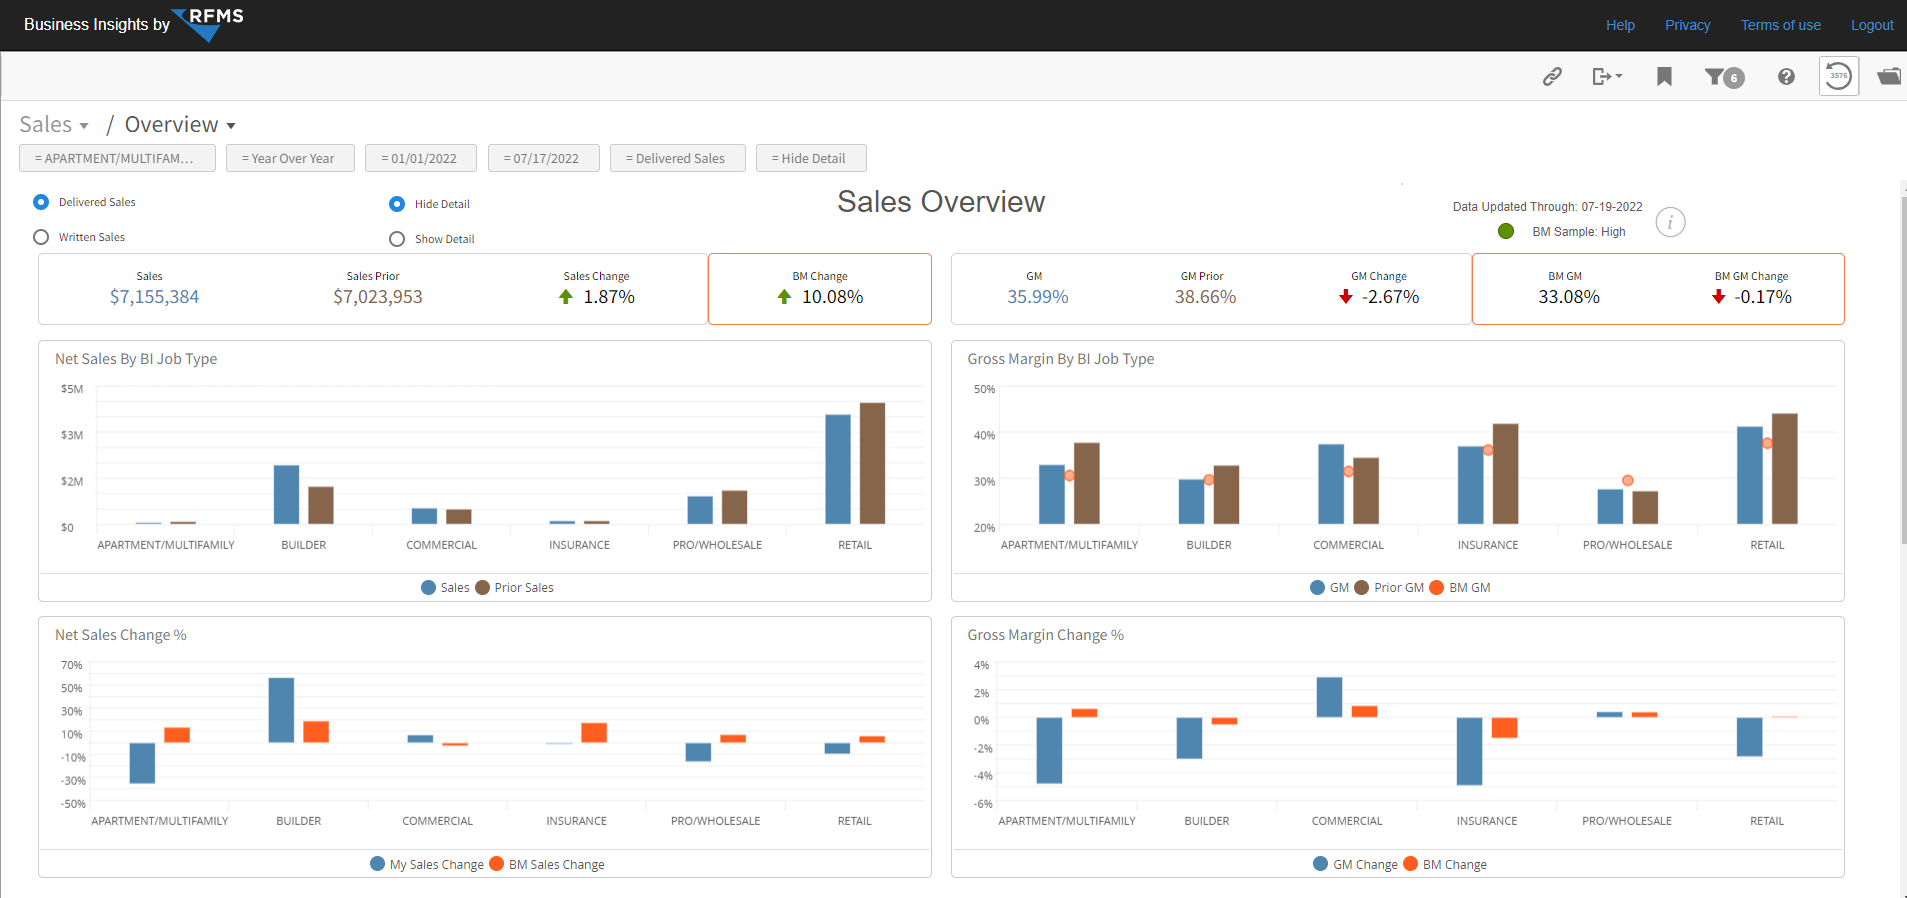
This dashboard provides an overview of a company's performance of all stores and job types based on Net Sales and Gross Margin.
Select the Delivered Sales or Written Sales radio button to change the data displayed.
Select the Hide Detail or Show Detail radio button to show the detail records associated with the filtered data displayed.
Delivered Sales
RFMS orders that have been job costed with a delivered date.
Written Sales
Written Sales are orders created in the RFMS system. A written sale is based on the order date. If a written sale has been delivered and job costed, it will still be considered part of the written sales for the selected order date.
Show/Hide Detail
This radio button turns on or off the detail records associated with the filtered data displayed.

Key Performance Indicators (KPI's):
Sales: Gross Sales minus Sales Tax for the selected date range.
Sales Prior: Gross Sales minus Sales Tax for the prior selected date range (either Year Over Year or Trailing Months).
Sales Change: The percentage of change in net sales between the current and previous period of time for the selected date range.
Sales BM (Benchmark) Change: The percentage of change in the net sales benchmark between the current and previous period of time for the selected date range.
Gross Margin: Net sales revenue minus cost of goods sold, divided by net sales revenue for the selected date range.
Note: Cost of Goods Sold excludes overhead, and load.
Gross Margin Prior: Total sales revenue minus cost of goods sold, divided by total sales revenue for the prior date range (either Year over Year or Trailing Months).
Gross Margin Change: The percentage of change in gross margin between the current and previous period of time selected in the "active filters".
BM (Benchmark) GM (Gross Margin): Total sales revenue minus cost of goods sold, divided by total sales revenue for qualified Business Insights participants.
BM (Benchmark) GM (Gross Margin) Change: The percentage of change in the Gross Margin Benchmark between the current and previous period of time for the selected date range. (Total sales revenue minus cost of goods sold, divided by total sales revenue for qualified Business Insights participants.)
Charts
Net Sales By BI Job Type: Net Sales is displayed by Job Type for the selected date with a blue column and the prior period is displayed with a brown brown column. Hovering either visual will display the total net sales numerically for that Job Type.
Note: For Job Type Mappings see the My Job Types chart under the Profile Collection
Gross Margin By BI Job Type: Gross Margin is displayed by Job Type for the selected date with a blue column, the prior period is displayed with a brown column and the Benchmark Gross Margin is displayed with an orange indicator dot. Hovering over the three visuals in the respective Job Type category will display the Gross Margin by Job Type.
Net Sales Change Percentage By Job Type: Net Sales percentage of change is displayed by Job Type for the selected date with a blue column and the Net Sales percentage of change benchmark is displayed with an orange column. Hovering either visual will display the total net sales and benchmark percentage of change for that Job Type.
Gross Margin Change Percentage By Job Type: Gross Margin change percentage is displayed by Job Type for the selected date with a blue column and the benchmark is displayed with an orange column. Hovering over either visual in the respective Job Type category will display the Gross Margin percentage and benchmark percentage by Job Type.
Comments
Article is closed for comments.